Introduction
Welcome to today’s SDR (Software-Defined Radio) challenge! In this exercise, we’ll walk you through using an RTL-SDR (or similar) and CubicSDR to explore local radio signals, capture NOAA weather frequencies, and even track aircraft flight data using dump1090-fa. These drills are designed for beginners, so don’t worry if you’re new to this – we’ll guide you step by step.
Let’s dive in and start tuning into the invisible world of radio frequencies!
Drills
1. Setting up the RTL-SDR and CubicSDR
Goal: Successfully set up your RTL-SDR dongle and use CubicSDR to identify and visualize radio frequencies.
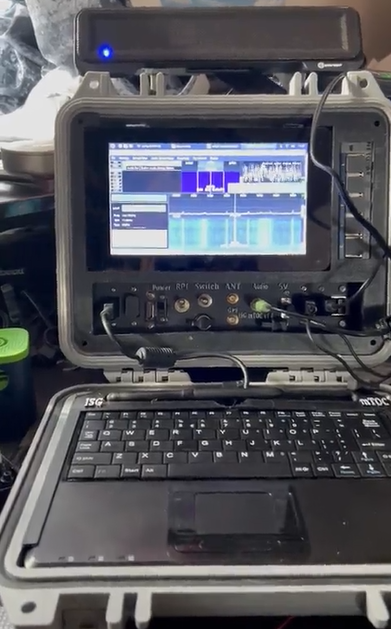
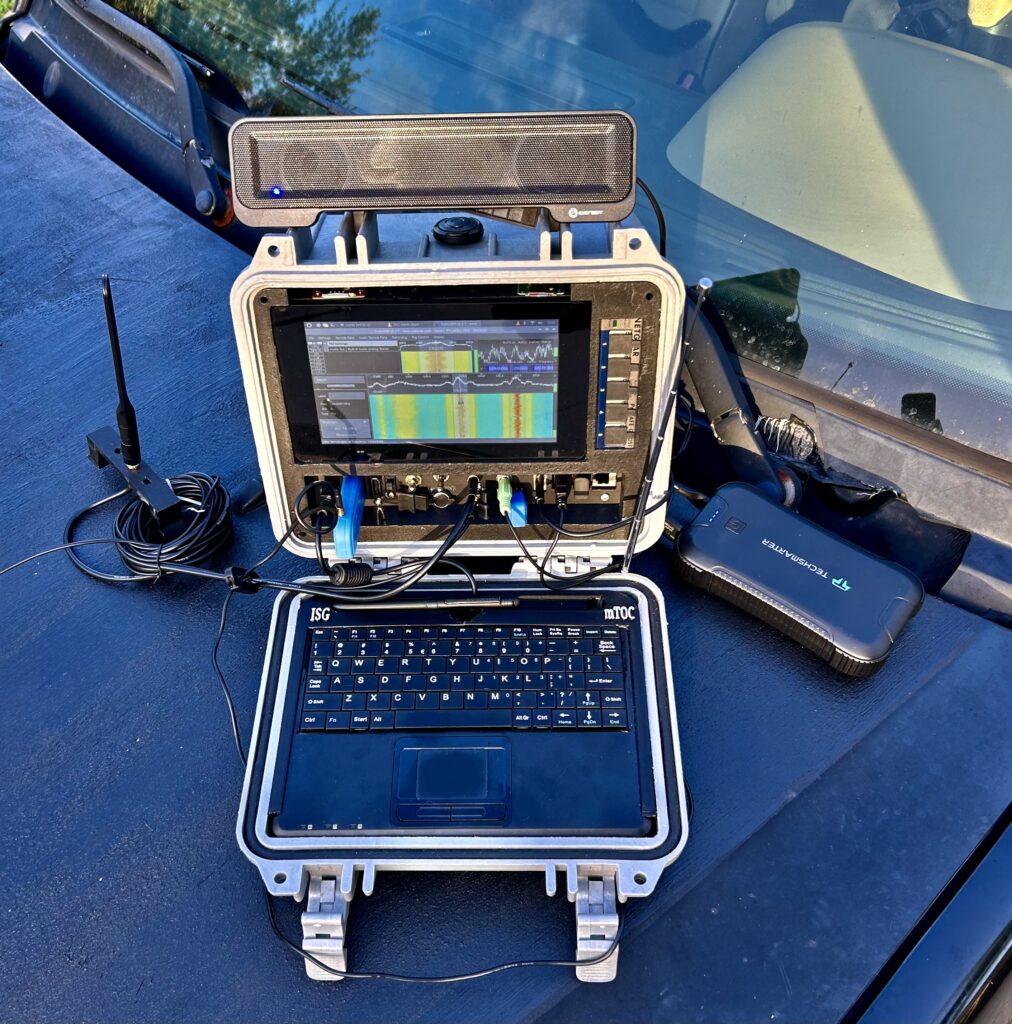
- Hardware Check: Plug your RTL-SDR dongle into a USB port on your mTOC terminal. Ensure the included antenna is securely attached.
- Install Required Software:
Run the following commands in your terminal:sudo apt update
sudo cubic-sdr –version
As long as cubic-sdr is current, you can skip the final step. If you’re building your own mTOC, you may need to install it using the following command:sudo apt install rtl-sdr cubic-sdr - Launch CubicSDR: Open the application from your desktop or by typing
cubic-sdrin the terminal, or, using the graphic user interface (GUI), double click the CubicSDR icon. We will focus on the GUI, because that’s the best place to start. - Select Your Device: When prompted, select your RTL-SDR device from the list and click
Start.
Hint: If you don’t see the device, ensure it’s plugged in and that drivers were installed correctly. You can check with:rtl_test
CubicSDR GUI Walkthrough

To make your experience with CubicSDR seamless, let’s take a closer look at the interface and how to navigate the waterfall effectively.
Overview of the CubicSDR Interface
When you launch CubicSDR, you’ll see several key elements:
- Frequency Spectrum (Top):
A live view of signals in your selected frequency range. Strong signals appear as spikes. - Waterfall Display (Bottom):
A time-based view of frequency activity. Bright spots indicate strong signals. - Controls Panel (Right):
Contains essential tuning and modulation options. - Frequency Bar (Top Toolbar):
Displays your current frequency. You can click and drag to adjust or type in a specific frequency.
Basic Controls for the Waterfall

- Zooming In/Out:
- Use your mouse scroll wheel or the zoom slider in the toolbar to focus on specific ranges of frequencies.
- Higher zoom levels allow for more precise tuning.
- Tuning to a Frequency:
- Click directly on the waterfall display or frequency spectrum to tune.
- Adjust the tuning marker to center it over a signal for clarity.
- Adjusting Gain and Filters:
- Gain Control: Located in the controls panel, adjusts the sensitivity of your SDR. Increase gain for weak signals, but avoid too much noise.
- Filters: Use the bandpass filters to reduce noise and focus on specific signals. Experiment with filter widths for the clearest sound.
- Modulation Selection:
- Once tuned to a frequency, select the appropriate modulation mode:
- WFM: Wideband FM, used for radio stations.
- NBFM: Narrowband FM, used for NOAA weather or HAM radio.
- AM: Amplitude modulation, for older broadcasts or aviation.
- USB/LSB: Upper/Lower Sideband, used in amateur radio and HF bands.
- Once tuned to a frequency, select the appropriate modulation mode:
Fine-Tuning Techniques
- Adjust the Waterfall Speed:
In the settings menu, reduce the waterfall speed to focus on slower signals or increase it to monitor fast-moving signals. - Signal Clarity:
- Use the AGC (Automatic Gain Control) toggle for automatic signal adjustments.
- If AGC is off, manually balance gain to isolate the signal without excessive background noise.
- Bookmarks:
- Use bookmarks to save interesting frequencies. This is especially useful for revisiting NOAA weather or other known broadcasts.
Practical Tips for Exploration
- Finding Quiet Bands:
If you’re lost, explore the FM range (88 MHz – 108 MHz) or NOAA weather frequencies (162.400 MHz – 162.550 MHz). - Noise vs. Signal:
Look for steady, bright lines in the waterfall. Static noise will be more diffuse and inconsistent.
Outcome
After completing this tutorial, you should feel comfortable navigating the CubicSDR GUI, tuning into signals with ease, and adjusting settings to enhance your listening experience.
Now, you should have CubicSDR running with your device ready to capture signals.
2. Exploring the Waterfall Display
Goal: Understand the waterfall display in CubicSDR.
- What is the Waterfall? It’s a live visualization of radio signals. The x-axis represents frequency, and the y-axis shows time. Brighter spots indicate stronger signals.
- Adjust Settings: Use the scroll wheel or frequency sliders to zoom in and out on specific ranges.
- Identify Signals: Look for bright, consistent bands – these indicate active frequencies.
Tip: Hover over signals and click to tune into them. Adjust gain and filters for better clarity.
Outcome: You should be familiar with navigating the waterfall display and tuning into signals.
3. FM Radio: Local Broadcasts
Goal: Capture and listen to a local FM radio station.
- Find a Station: Most FM radio stations are between 88 MHz and 108 MHz.
- Tuning: Click on a signal in the FM range. Use the demodulation dropdown to select “WFM” (Wideband FM).
- Listen: Adjust your volume and enjoy the broadcast.
Hint: Use online station directories or smartphone apps to find the exact frequency of local stations near you.
Outcome: You’ll hear your first FM broadcast through CubicSDR!
4. NOAA Weather Radio: NBFM
Goal: Tune into NOAA’s local weather frequency using Narrowband FM (NBFM).
- Find the Frequency: NOAA weather radio operates around 162.400 MHz to 162.550 MHz. Look for consistent signals in this range.
- Adjust Modulation: Select “NBFM” as the demodulation type in CubicSDR.
- Listen to Alerts: You should hear a weather broadcast detailing local forecasts and alerts.
Tip: NOAA frequencies are typically static and should appear as bright, steady signals on the waterfall.
Outcome: Capture and listen to your local NOAA weather station.
5. Flight Tracking: dump1090-fa
Goal: Use dump1090-fa to capture flight data broadcast by aircraft in your area.
- Install dump1090-fa (for mTOC builds only! If you purchased one, this software is installed)
Run the following commands:sudo apt update sudo apt install dump1090-fa - Run dump1090-fa:
Start capturing flight data with:
codedump1090-fa --interactive - View Flights: You’ll see a live feed of ADS-B transmissions from planes in range. Data includes flight number, altitude, speed, and location.
Bonus Challenge: Connect dump1090-fa to a web server for a visual map of flight paths:sudo apt install lighttpd
sudo systemctl start lighttpd
dump1090-fa --net --interactive
Bonus Challenge 2: Pick a tail number, and monitor it’s movements for 5 minutes. Plot on a map where it went using a pins, and a string to approximate flight altitude. Consider how understanding normal air traffic routes could be beneficial!
Open a browser and go to http://localhost/dump1090-fa/ to view aircraft on a map.
Outcome: You’ll gain insight into how ADS-B works and see local flights in real time.
Conclusion
Hopefully, these drills have sparked your curiosity about the world of radio waves and data broadcasts. From listening to FM radio and weather updates to tracking flights in your area, SDR opens up a world of possibilities. Stay tuned (pun intended!) for more challenges, and share your results in the comments below!
What signal did you tune into? Did you manage to track any flights? Let us know!


